Something went wrong. Please refresh the page and try again.
Something went wrong. Please refresh the page and try again.
Notifications can be turned off anytime from settings.
Item(s) Added To cart
Qty.
Something went wrong. Please refresh the page and try again.
Something went wrong. Please refresh the page and try again.
Exchange offer not applicable. New product price is lower than exchange product price
Please check the updated No Cost EMI details on the payment page
Exchange offer is not applicable with this product
Exchange Offer cannot be clubbed with Bajaj Finserv for this product
Product price & seller has been updated as per Bajaj Finserv EMI option
Please apply exchange offer again
Your item has been added to Shortlist.
View AllYour Item has been added to Shopping List
View AllSorry! Data Science with R - Become Certified Data Scientist - Live Instructor Led Online Course (Learn R, SQL and Excel) by Jigsaw Academy is sold out.


You will be notified when this product will be in stock
PRODUCT DESCRIPTION:
Course duration: 17 weeks
Work load: 10-15 hours per week
What are the benefits of this course?
After completing this course you will acquire expertise with statistical concepts, predictive analytics skills and analytic tools (R and Hadoop). You will also be able to use statistical techniques to analyze data to make business decisions.
Who should do this Course?
This course is designed for –
What do you get when you enrol for this course?
1. Jigsaw Academy's comprehensive modules to help you become an expert data scientist
2. Q&A sessions with faculty included
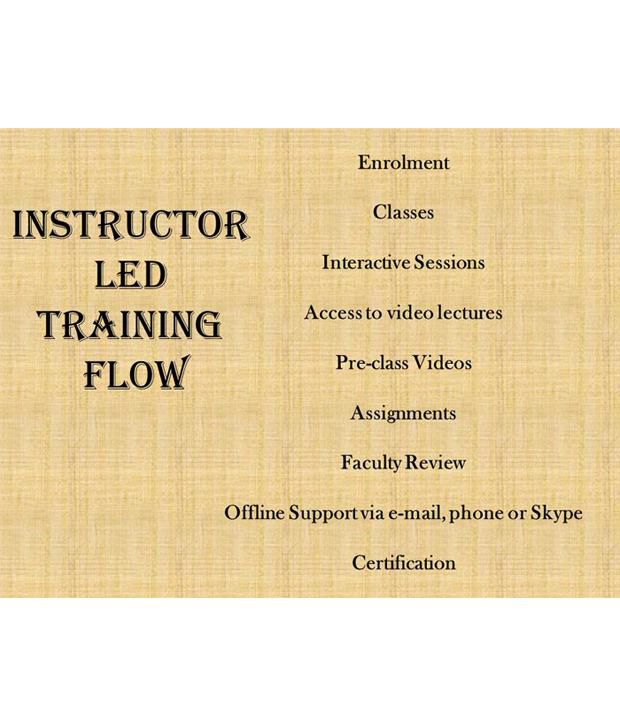
3. Live Classes : Live classes are conducted by analytics experts in Jigsaw Academy's virtual classroom. The live classes are full interactive and participants can ask questions and get doubts clarified. (17 live sessions of 2 hours each)
4. Learning Center : Participants have access to a variety of supplemental resources - Reference materials, guides, white papers etc. via the Learning Centre.
5. Offline Faculty Support : Participants also get access to faculty via email, phone or Skype for help with the course as required, in additional to the scheduled Q&A sessions.
6. Q&A Sessions : As a part of the course, participants also have live Q&A sessions on a fixed schedule with the faculty for the course. These question and answer sessions can be used for help with assignments, concepts covered, and any other content related questions.
All these sessions are also recorded, and participants get access to recordings to review material or to make up for any missed Q&A sessions.
This Data Science Certification course comes with 2 hours of Q&A every month, with live sessions of 2 hours each with course faculty.
7. Video based training : Participants will get access to about 40 hours of pre-recorded video lectures & 20 hours of pre-recorded classroom training. The videos can be viewed at any time and as many times as the participant wants. Participants will have access to the video lectures for a period of 6 months.
8. Student Forums : Participants will have access to student forums where they can ask any questions related to big data and analytics. Student forums will help you connect with the Jigsaw analytics community.
9. Virtual Lab : Participants are given access to Jigsaw Academy's virtual lab-a unique cloud-based solution to providing the lab experience. You will be able to work on real life business datasets.
What will you get at the end of the course?
Introduction to Analytics
Course Modules:
- What is Analytics?
- Popular Tools
- Role of Data Scientist
- Analytics Methodology
- Problem Definition
Predictive Modeling Techniques
- Linear Regression
- Logistic Regression
- Cluster Analysis
- Decision Trees
- Time Series Analysis
Statistical Concepts and their application in business
- Descriptive Statistics
- Probability Theory
- Tests of Significance
- Non-parametric Testing
Working with Big Data
- Examples of Big Data
- Introduction to Map Reduce
- Working with Hadoop
Basic Analytic Techniques
- Introduction to R
- Data Exploration with R
- Data Preparation with R
- Data Visualization with R
Putting the Jigsaw Together
- Model Validation
- Creating Insights from Statistics
- Online Resources
- Connecting with the Analytics Community
Case Studies
01 Predicting the price of a car
In this case study, we predict the price of a car based upon variables like the model, make and its engine capacity, among others. The data set has 12 columns, and to predict the target variable, multiple linear regression is used. The model is then analysed further to improve its performance.
02 Customer behaviour on a loan
Using bank data with 21 columns the objective is to predict the defaulting behaviour of a customer. The data is analysed by logistic regression as well as using decision trees giving the insights and comparison for both the techniques.
03 Analysis of grocery sales in different stores in Karnataka and Tamil Nadu
The analysis is on a mix of sales by category and average sales per square foot of space for a grocery retailer with 515 stores.
04 Predicting the money bet on a horse race
The aim of this study is to come up with recommendations to a client who is in the horse racing industry on how to maximize money bet on any race. Insights are generated from data having 23 columns with different track types and years in which the races were conducted.
05 Analysis of customer attrition in the telecom industry
The goal of the study is to analyse customer attrition based upon minutes used, age and other demographic information.
To get more information, you may want to watch the video below
Learn Everything, Anywhere, Anytime
India's Largest Online Education Marketplace
The images represent actual product though color of the image and product may slightly differ.
Register now to get updates on promotions and
coupons. Or Download App